File:20211026 Cumulative carbon dioxide CO2 emissions by country - bar chart.svg

此SVG文件的PNG预览的大小:800 × 450像素。 其他分辨率:320 × 180像素 | 640 × 360像素 | 1,024 × 576像素 | 1,280 × 720像素 | 2,560 × 1,440像素 | 1,200 × 675像素。
原始文件 (SVG文件,尺寸为1,200 × 675像素,文件大小:5 KB)
摘要
| 描述 |
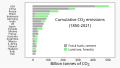
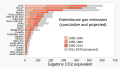
English: Bar chart of cumulative carbon dioxide CO₂ emissions by country (1850–2021)
|
| 日期 | |
| 来源 | 自己的作品 |
| 作者 | RCraig09 |
Related files
The following files relate to cumulative greenhouse gas emissions, some by country, some grouped by region:
-
 20211026 Cumulative carbon dioxide CO₂ emissions by country - bar chart.svg
 -
 20211228 Cumulative greenhouse gas emissions by country and region - bar chart.svg
 -
 1850-2019 Cumulative greenhouse gas emissions by region - bar chart - IPCC AR6 WG3 - Fig SPM.2b.svg


许可协议
我,本作品著作权人,特此采用以下许可协议发表本作品:
本文件采用知识共享署名-相同方式共享 4.0 国际许可协议授权。
- 您可以自由地:
- 共享 – 复制、发行并传播本作品
- 修改 – 改编作品
- 惟须遵守下列条件:
- 署名 – 您必须对作品进行署名,提供授权条款的链接,并说明是否对原始内容进行了更改。您可以用任何合理的方式来署名,但不得以任何方式表明许可人认可您或您的使用。
- 相同方式共享 – 如果您再混合、转换或者基于本作品进行创作,您必须以与原先许可协议相同或相兼容的许可协议分发您贡献的作品。
Original data
Numerical data copied from source to form chart.
- Note that four countries have negative values in the rightmost column; this is not an error.
Fossil fuels, cement Land use, forestry
USA 420.00 89.10
China 241.80 42.60
Russia 117.30 55.20
Brazil 16.00 96.90
Indonesia 14.60 87.90
Germany 93.10 -4.60
India 57.10 28.60
UK 74.90 0.00
Japan 66.70 1.30
Canada 34.20 31.30
Ukraine 30.00 10.60
France 38.50 -3.00
Australia 18.90 16.10
Argentina 8.60 23.70
Mexico 20.60 11.20
S. Africa 21.60 6.50
Poland 28.10 -2.50
Thailand 7.70 16.40
Italy 25.00 -1.60
Iran 19.70 1.90
文件历史
点击某个日期/时间查看对应时刻的文件。
| 日期/时间 | 缩略图 | 大小 | 用户 | 备注 | |
|---|---|---|---|---|---|
| 当前 | 2021年10月26日 (二) 19:17 | | 1,200 × 675(5 KB) | RCraig09 | Uploaded own work with UploadWizard |
文件用途
以下页面使用本文件:
全域文件用途
以下其他wiki使用此文件:
- bn.wikipedia.org上的用途
- en.wikipedia.org上的用途
- List of countries by carbon dioxide emissions
- List of countries by carbon dioxide emissions per capita
- Carbon dioxide in Earth's atmosphere
- Greenhouse gas emissions by the United States
- Climate justice
- Talk:Greenhouse gas/Archive 5
- Portal:Climate change
- Talk:Climate change in the United States/Archive 1
- User:W.stanovsky/climate
- User:Florin Talasman/sandbox
- gl.wikipedia.org上的用途
- id.wikipedia.org上的用途
- pt.wikipedia.org上的用途
- ro.wikipedia.org上的用途